

English
Calibration and reports
For Human Capital, available once scorecards reach the Calibration stage.
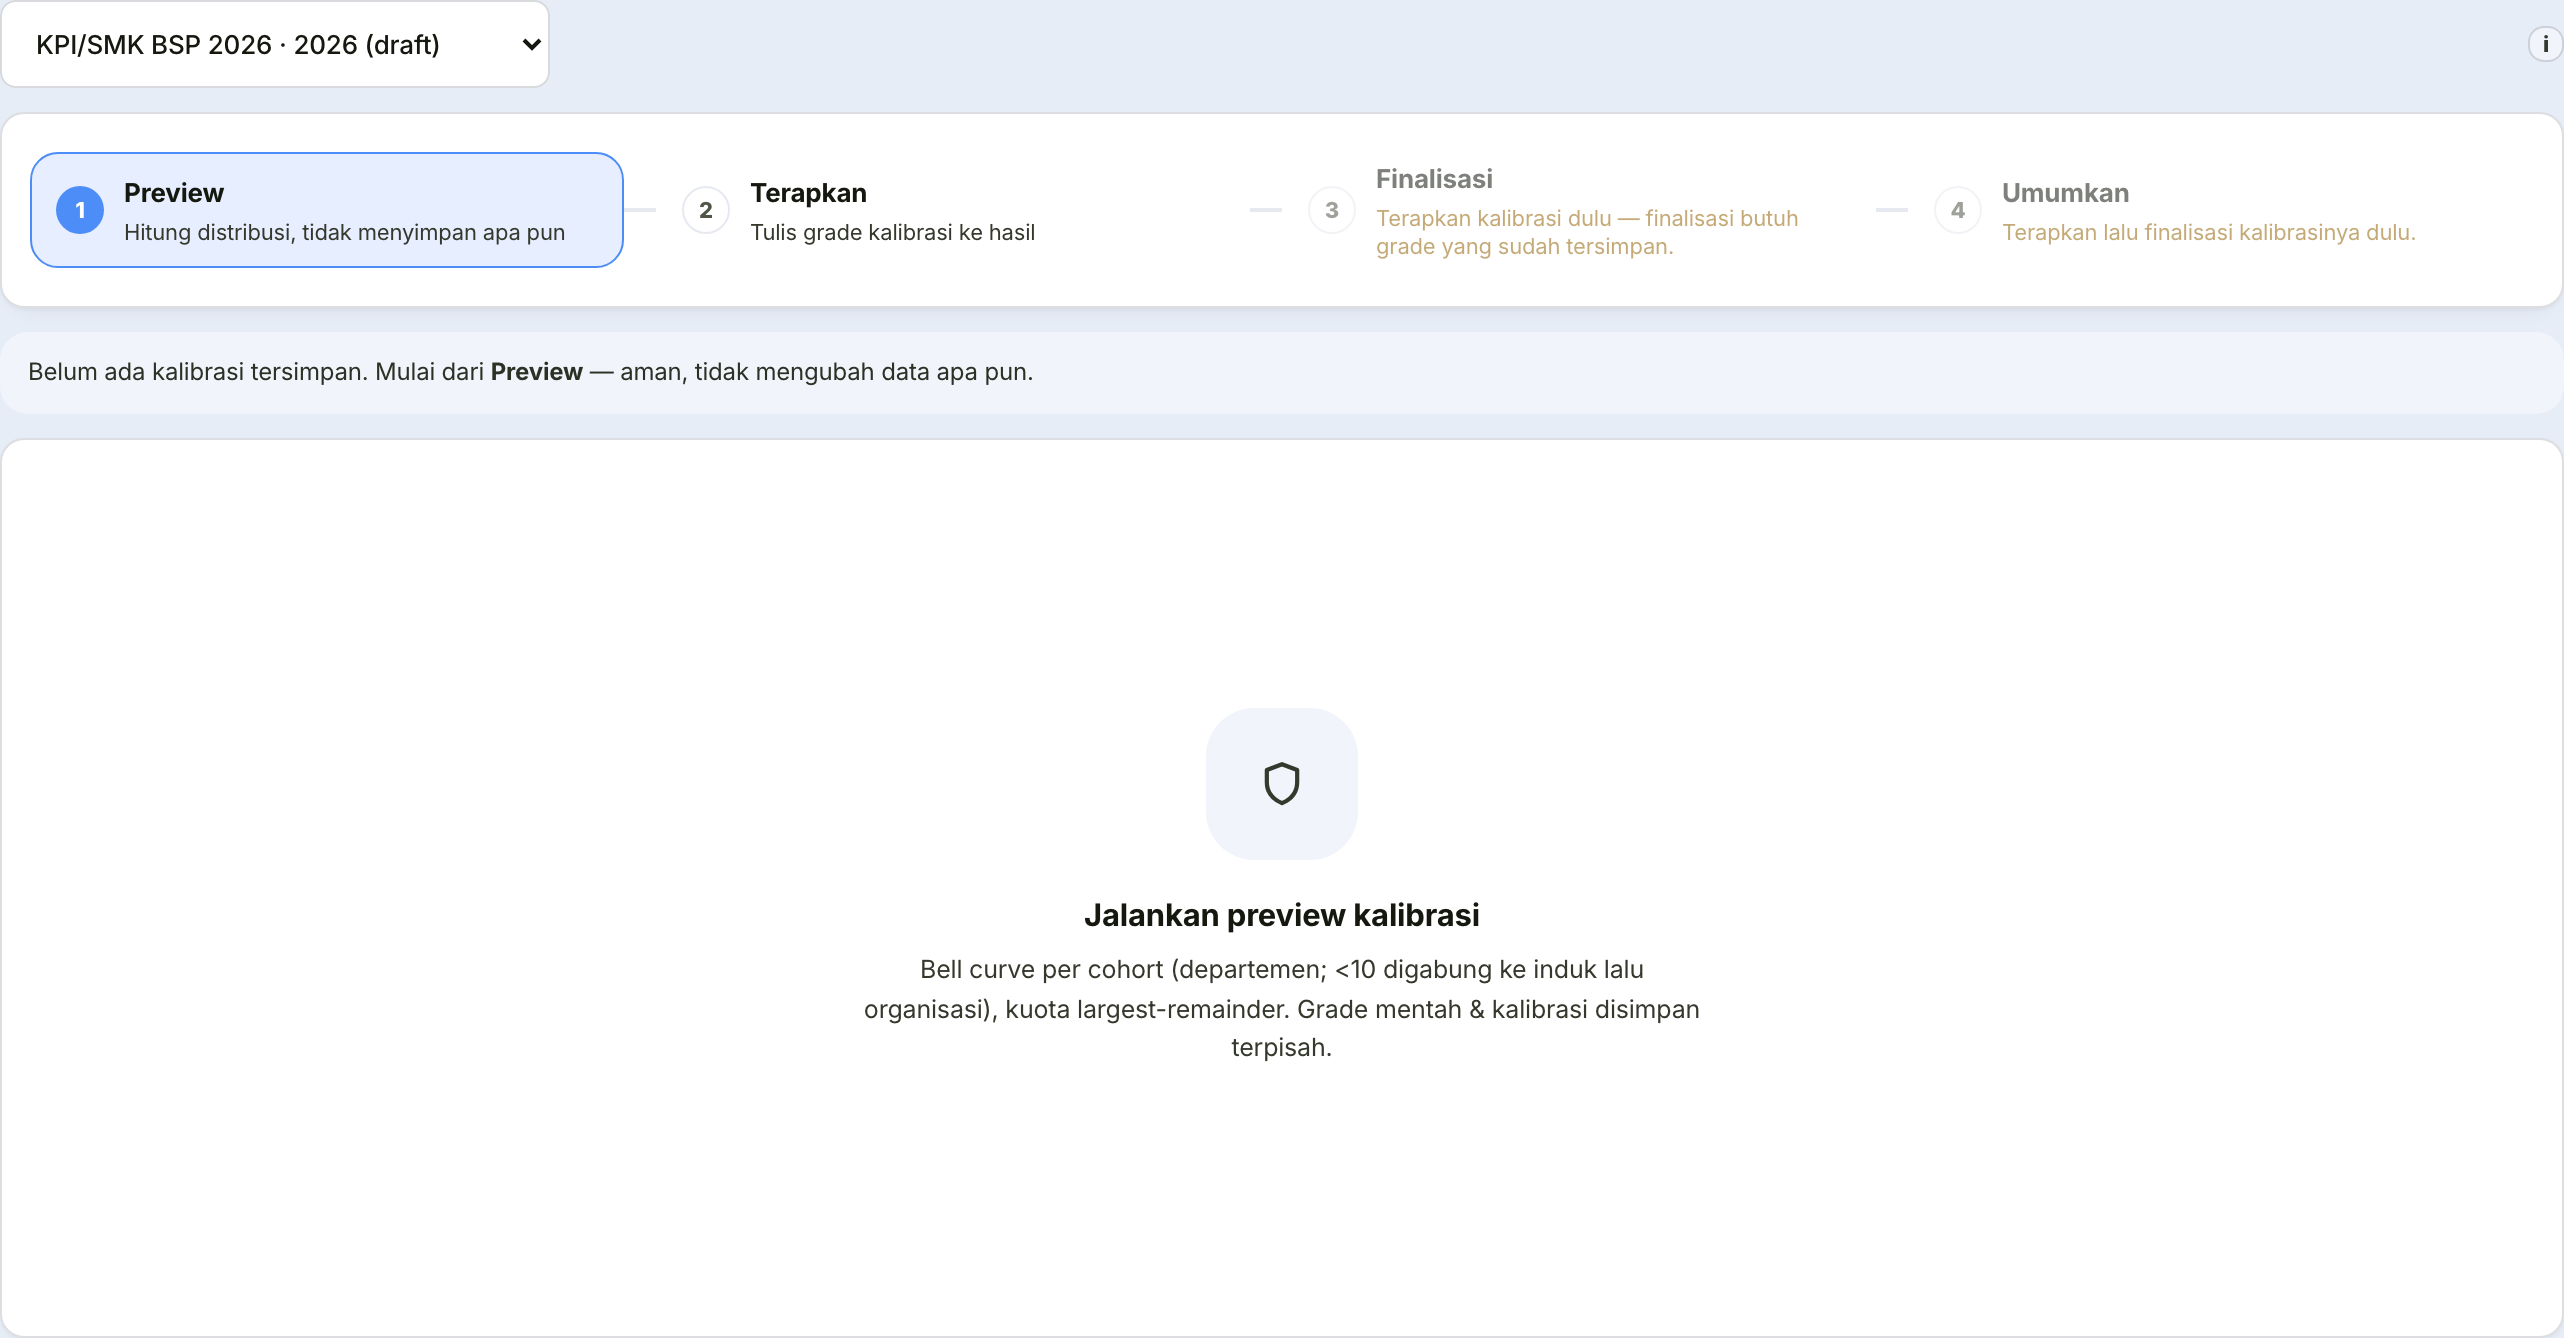
Calibration
| Section | What it holds |
|---|---|
| Distribution preview | The spread of grades within a cohort, so not everyone lands on the top grade |
| Per-person list | Raw scores and calculated grades |
| Grade adjustment | Changing someone's grade |
| Filters | Department and grade |
Changing someone's grade
| Field | What it holds |
|---|---|
| Grade | The new grade |
| Reason | Mandatory. Recorded permanently and readable in reports |
The stages after
A panel session settles ties and adjustments, then finalisation locks the results, and announcement makes them visible to employees.
A tie holds up finalisation
If two people land on exactly the same score but on opposite sides of a grade quota boundary, the system records it as a tie and will not allow finalisation until one of them is settled through Grade adjustment above (which already requires a reason). Without that decision, who gets the higher grade would come down to nothing more than data order, not anyone's judgement.
A cohort that is too small is not curved
If a cohort's headcount is still below its "Minimum group size" even after merging up to the organisation level, the distribution curve is skipped and raw grades are used as they are — rather than forced into a shape that does not describe a real spread.
Finalisation cannot be undone
After finalising, no grade can be changed again.
Settle every adjustment before pressing it.
Reports
Results at three levels — corporate, unit, and individual — with department and grade filters, a name search, and export.
Clicking a row opens one person's detail: how their score was built per quarter, their adjustment record, and a comparison of the raw grade against the calibrated grade.
KPI Dashboard
Analytics for one programme and quarter:
| Chart | Answers |
|---|---|
| Grade distribution | Whether the curve is healthy or bunched on one grade |
| Score histogram | Where the mass of employees sits |
| Quarter-on-quarter trend | Whether performance is moving up or down |
| Unit comparison | Which units stand out and which lag |
A curve bunched on one grade is a signal
When nearly everyone receives the same grade, it is usually not because everyone performed the same — it is because the targets were too easy, or the assessors avoided drawing distinctions.
Either way, the assessment has lost its purpose.